
We consider the Relative Strength Index (RSI) to be one of the best indicators available. There are a number of books and articles written about RSI, how to use it, and the value it provides in predicting the short-term direction of stock prices. Unfortunately, few, if any, of these claims are backed up by statistical studies. This is very surprising considering how popular RSI is as an indicator and how many traders rely upon it.
Most traders use the 14-period RSI, However, when you shorten the timeframe you start seeing some very impressive results. Most research shows that the most robust and consistent results are obtained by using a 2-period RSI and traders built many successful trading systems that incorporate the 2-period RSI.
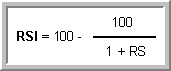
Before getting to the actual strategy, here's a little background on the RSI and how it's calculated
Relative Strength Index
The Relative Strength Index (RSI) was developed by J. Welles Wilder in the 1970's. It is a very useful and popular momentum oscillator that compares the magnitude of a stock's recent gains to the magnitude of its recent losses.
As mentioned above, the default/most common setting for RSI is 14-periods. You can change this default setting in most charting packages very easily but if you are unsure how to do this please contact your software vendor.
We then quantified overbought and oversold conditions as measured by the 2-period RSI reading being above 90 (overbought) and below 10 (oversold). In other words we looked at all stocks with a 2-period RSI reading above 90, 95, 98 and 99, which we consider overbought; and all stocks with a 2-period RSI reading below 10, 5, 2 and 1, which we consider oversold. We then compared these results to the benchmarks, here's what we found:
The average returns of stocks with a 2-period RSI reading below 10 outperformed the benchmark
1-day (+0.06%), 2-days (+0.21%), and 1-week later (+0.50%).
The average returns of stocks with a 2-period RSI reading below 5 significantly outperformed the benchmark
1-day (+0.12%), 2-days (+0.33%), and 1-week later (+0.65%).
The average returns of stocks with a 2-period RSI reading below 2 significantly outperformed the benchmark
1-day (+0.22%), 2-days (+0.51%), and 1-week later (+0.87%).
The average returns of stocks with a 2-period RSI reading below 1 significantly outperformed the benchmark
1-day (+0.27), 2-days (+0.62%), and 1-week later (+1.05%).
This means traders should look to build strategies around stocks with a 2-period RSI reading below 10.
Overbought
The average returns of stocks with a 2-period RSI reading above 90 underperformed the benchmark
2-days, and 1-week later.
The average returns of stocks with a 2-period RSI reading above 95 underperformed the benchmark
2-days later, and were negative 1-week later (-0.03%).
The average returns of stocks with a 2-period RSI reading above 98 were negative 1-day (-0.02%),
The average returns of stocks with a 2-period RSI reading above 99 were negative 1-day (-0.08%),
2-days (-0.24%), and 1-week later (-0.31%).
When looking at these results, it is important to understand that the performance deteriorated dramatically each step of the way. The average returns of stocks with a 2-period RSI reading above 98 were significantly lower than those stocks with a 2-period RSI reading above 95, etc.
This means stocks with a 2-period RSI reading above 90 should be avoided. Aggressive traders may look to build short selling strategies around these stocks.
2-days (-0.13%), and 1-week later (-0.18%).
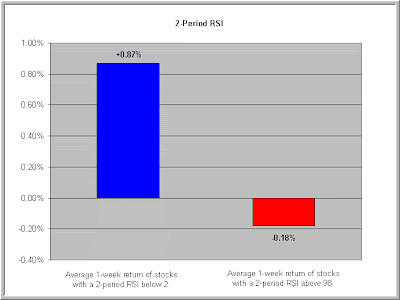
As you can see, on average, stocks with a 2-period RSI below 2 show a positive return over the next week (+0.87%). Also shown is that, on average, stocks with a 2-period RSI above 98 show a negative return over the next week.
Check the Live 2- period RSI(SCO) for NSE Stocks
Data is updated realtime using Y! Finance. You can get the RSI(2) values for
any kind of nse stocks for your analytics or trading purpose by just changing
the symbols of Yahoo stocks in [A1, B1, C1......Z1] cells
For Example B1 contains the value IDEA.NS.... if you change the value to
RCOM.NS you would get the values for Reliance Communication
Last 10 values of 2-period RSI has been computed in the sheet
And A20,B20,C20....Z20 REPRESENTS CURRENT LIVE 2-PERIOD RSI VALUE
And A21,B21,C21,....Z21 REPRESENTS YESTERDAYS 2-PERIOD RSI VALUE
And A22,B22,C22,....Z22 REPRESENTS DAY BEFORE YESTERDAY 2-PERIOD RSI VALUE
Just Check out the returns of Nifty and Essar Oil and whatever stocks mentioned in that List
Important Thing
If your trade to be more confident
For Stpcls RSI Values => If Less then 1 - Confirm then Buy When Greater then 99 - Confirm then Short
And for Nifty RSI Values => If closed Less than 5 then start go long next day and start average every day if RSI(2) closed below 5 and sell above 50 or higher values as Nifty is expected to turn upside in next 1-2 days
And for Nifty RSI Values => If closed Greater than 95 then go short next day and start average shorts above every day and sell below 50 or even lower as Nifty is expected to turn downside in next 1-2 days

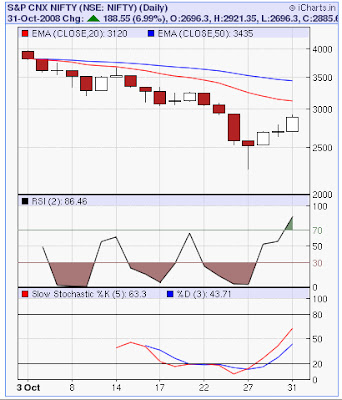
OCT 27 - 3.90
OCT 28 - 52-98
OCT 29 - 56.43
OCT 30 - 86
Just Check it out in RSI(2) Values
We should look for only Long Signal in RSI(2) for Better Returns
2)When the stock is trading above 200 day Moving Average (Bear Markets)
We should look for only Short Signal in RSI(2) for Better Returns
Unfortunately none of the stocks are trading above 200 day Moving Average

So that you can vary the edit the parameters in the Spread Sheet
2) TO Get the RSI(2) values for a particular stock say RNRL then the corresonding
yahoo stock code for RNRL is RNRL.NS.
3)So delete ^NSEI in A1 cell and type RNRL.NS then you will get the corresponding
RSI(2) Values and the stock price values in the Coloumn A.
6)RSI(2) values below 5 and above 95 will be highlighted in red color
1)http://www.tradingmarkets.com/.site/stocks/commentary/editorial/2-Period-RSI.cfm
2)http://tradewhileworking.blogspot.com/2007/10/new-research-on-rsi2-profitable.html
3)http://www.tradingmarkets.com/.site/stocks/commentary/editorial/The-Improved-R2-Strategy.cfm
4)http://tradinggoddess.blogspot.com/2007/10/rsi2-in-short-term-trading.html
5)http://stockcharts.com/school/doku.php?id=chart_school:technical_indicators:relative_strength_index_rsi
Choose the stocks as what RSI(2) indicator Suggest You
Dont pick the stocks and see the indcator levels to meet your expectations
Let them work for you. Dont Expect anything from it
Happy Trading !!!!


1 comments
Hats off to you sir...you are doing a great work.
Post a Comment