
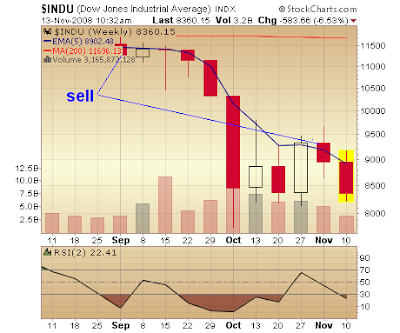
Chart shows the candlestick pattern of DowJones 3 month Chart.
Our 5 EMA trading system strategy shows a sell signal right from the last week in the dow charts. So Any close below 8900 will defenitely invoke a further selloff for the next week. Only a close above 8900 within coming friday will restore buy signal in the weekly charts which looks impossible as of now. Else Probably testing of new lows.
Happy Trading!!!!
[11/13/2008 09:26:00 PM
|
0
comments
]


0 comments
Post a Comment